

As connected smart pet appliances become permanent fixtures in modern households, a common question arises among energy-conscious pet owners: what is the actual environmental and utility impact of running automated dispensers 24/7? Between high-frequency 2.4 GHz Wi-Fi transceivers, active infrared meal sensors, and periodic stepper motor actuations, analyzing smart pet feeder electricity consumption reveals surprising insights into pet-tech energy efficiency and grid resiliency.
Fortunately, modern consumer electronics engineering has made smart feeders and water fountains remarkably efficient. Most devices operate on low-voltage direct current (5V or 12V DC) driven by compact switched-mode power supplies. However, calculating standby quiescent draw versus active dispensing torque becomes vital when planning emergency backup systems. In this comprehensive technical guide, we benchmark real-world wattage across popular models, calculate annual operating costs, and provide an engineering sizing guide for mini DC uninterruptible power supplies (UPS).
Table of Contents
Real-World Wattage: Smart Feeders vs. Smart Fountains
To accurately assess power draw, it is essential to distinguish between the two primary continuous smart appliances: automatic feeders and motorized water fountains. While both utilize wall-wart power adapters, their operational duty cycles differ dramatically.
An automatic pet feeder remains in an ultra-low-power idle state for approximately 99.8% of the day. The internal microcontroller (frequently an ESP32 or Realtek RTL8720 Wi-Fi module) maintains an active TCP keep-alive heartbeat with the cloud server while optical sensors scan the chute. High-current demand only occurs during the 5 to 15 seconds when the geared DC stepper motor rotates the silicone impeller rotor to dispense kibble.
Conversely, a standard smart cat fountain features a continuous-duty submersible magnetic-drive impeller pump operating 24 hours a day, 365 days a year. Even though fountain pumps draw modest wattage (typically 1.0W to 2.5W), continuous operation accumulates significantly more kilowatt-hours (kWh) over time than an intermittent feeder.
Benchmarking Smart Pet Feeder Electricity Consumption by Mode
Using calibrated digital benchtop power meters and plug-in wattmeters, we recorded power consumption across five distinct operational modes commonly found in modern Wi-Fi and camera-enabled pet feeders:
| Operational State | Typical Voltage / Current | Power Draw (Watts) | Daily Duration |
|---|---|---|---|
| Quiescent Idle (Standard Wi-Fi) | 5.0V @ 0.08A – 0.12A | 0.4W – 0.6W | ~23.8 Hours |
| Idle with 1080p/2K Live Camera | 5.0V @ 0.35A – 0.50A | 1.8W – 2.5W | ~23.8 Hours |
| Active Motor Rotation (Dispensing) | 5.0V @ 0.80A – 1.40A | 4.0W – 7.0W | ~45 Seconds |
| Night Vision IR LEDs Active | 5.0V @ 0.25A – 0.40A | 1.2W – 2.0W | ~8.0 Hours (Night) |
| Submersible Smart Fountain Pump | 5.0V @ 0.20A – 0.30A | 1.0W – 1.5W | 24.0 Hours Continuous |
As the telemetry demonstrates, an audio/video camera feeder with active night vision draws roughly 3 to 4 times the baseline electricity of an audio-only Wi-Fi feeder. However, across all categories, smart pet feeder electricity consumption remains remarkably low compared to traditional household white goods.
Annual Utility Costs: Running the Kilowatt-Hour Numbers
To calculate real annual expenses, we apply the national average residential electricity tariff documented by the U.S. Energy Information Administration (EIA), which averages approximately $0.165 per kilowatt-hour ($0.165/kWh):
1. Standard Wi-Fi Feeder (No Camera):
Average continuous draw: 0.5 Watts.
Annual consumption: (0.5W × 24h × 365d) / 1000 = 4.38 kWh/year.
Annual utility cost: 4.38 kWh × $0.165 = $0.72 per year.
2. Camera-Enabled Feeder with Night Vision:
Average blended draw: 1.8 Watts.
Annual consumption: (1.8W × 24h × 365d) / 1000 = 15.77 kWh/year.
Annual utility cost: 15.77 kWh × $0.165 = $2.60 per year.
3. Smart Pet Water Fountain (Continuous 1.5W Pump):
Average continuous draw: 1.5 Watts.
Annual consumption: (1.5W × 24h × 365d) / 1000 = 13.14 kWh/year.
Annual utility cost: 13.14 kWh × $0.165 = $2.17 per year.
Even combining an AI camera feeder and a continuous stainless steel fountain, total annual electricity cost remains under $5.00 per year. For pet owners debating mechanical simplicity versus connected convenience, our deep-dive comparison between gravity feeders and smart feeders explores whether this negligible electrical overhead justifies the substantial scheduling automation.
Sizing a Mini DC UPS for Power Outages
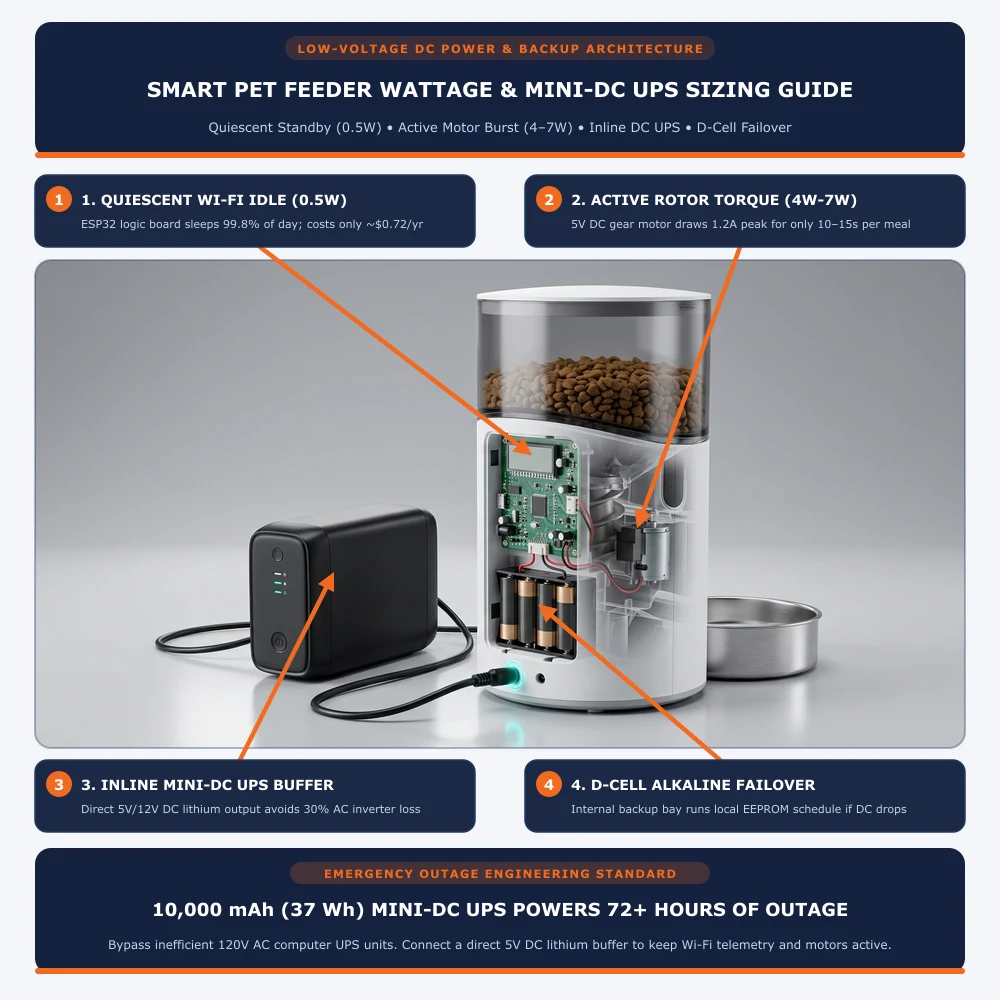
While energy costs are negligible, maintaining steady electricity is mission-critical. When a storm knocks out the local grid, standard feeder internal D-cell alkaline batteries often struggle. Alkaline cells experience chemical voltage sag and cannot power high-speed Wi-Fi chips or video streams.
Instead of relying on clunky AC-to-AC computer battery backups—which lose 25% to 30% of their energy converting DC battery power into 120V AC and back down to 5V DC—the ideal solution is an inline Mini DC UPS. These compact lithium-ion buffers output native 5V USB or 9V/12V DC barrel power directly to your pet appliance with zero conversion loss.
To size a battery for a standard 48-hour outage:
- Target Feeder Load: Standard Wi-Fi model drawing 0.5W at 5V DC (0.10 Amps).
- Daily Energy Required: 0.5W × 24 hours = 12 Watt-hours (Wh) per day.
- 48-Hour Run Requirement: 24 Wh. Adding a 20% safety margin for lithium discharge depth yields ~30 Wh.
- Capacity in Milliamp-Hours: A 3.7V nominal 10,000 mAh power bank contains approximately 37 Wh of capacity—more than enough to power an automatic feeder for nearly 3 full days of continuous offline dispensing.
For an in-depth breakdown of alkaline versus rechargeable lithium runtimes, read our complete guide on smart feeder battery backup times during power outages.
Firmware Optimizations to Reduce Standby Power Draw
If you operate multiple connected devices off a solar generator or battery bank, several firmware configurations allow you to cut standby power by up to 45% without sacrificing reliability:
- Enable Smart Radar Detection: Replace continuous infrared camera streaming with radar or PIR motion triggers. The camera module remains in sleep mode until animal proximity is detected.
- Adjust Fountain Intermittent Modes: Modern smart fountains offer “Smart / Sensor Mode” where the pump runs for 3 minutes and pauses for 3 minutes, or triggers only when an animal enters within 3 feet. This slashes annual pump kWh by 50% while extending pump impeller bearing life. Combine this with proper materials by consulting our guide on stainless steel vs. plastic cat fountain hygiene.
- Optimize Cloud Heartbeat Intervals: In custom smart-home platforms like Home Assistant or ESPHome, lengthen MQTT ping intervals from 5 seconds to 60 seconds, allowing the Wi-Fi transceiver to enter 802.11 DTIM power-save sleep between beacons.